Is Your Website Not Generating Clients? Check These 5 Brazilian Numbers
Your website gets visits but doesn't turn into leads or sales? Discover the numbers that truly matter for your business and compare your performance.
Is Your Website Not Generating Clients? The Fault Might Not Be Yours (But the Numbers Will Tell)
You invest in traffic, see visitors arriving at your website, but the contacts, quotes, and sales don't materialize? This frustration is common among Small and Medium-sized Business (SMB) owners and marketing managers. The big question is: is your website truly underperforming, or is it just average for the market?
Without concrete data and Brazilian benchmarks, it's easy to fall into generic diagnoses. To solve this, let's analyze the performance of your corporate or service website based on real national market data. This post won't just list potential problems; it will give you the benchmark to compare your website against the market average and the best in the industry.
Key Points
- Understand the Brazilian median conversion rate.
- Compare your website with different market segments.
- Discover which traffic sources yield the best results.
- Evaluate performance on mobile and desktop devices.
- Identify common bottlenecks that prevent lead generation.
The Brazilian Lead Generation Average: Where Does Your Website Fit In?
The study "Panorama de Geração de Leads 2026" (Lead Generation Landscape 2026) by Leadster analyzed 2,425 websites, over 173 million accesses, and 3.4 million leads generated across 17 market segments. This research offers us a true picture of Brazilian digital consumer behavior and website performance expectations.
The overall median conversion rate for Brazilian websites in 2026 is 3.07%. This means that, on average, 3 out of every 100 visitors become a lead or take a desired action. This figure represents an increase of 0.09 percentage points compared to the previous year.
To contextualize your performance, it's crucial to know the performance tiers:
- Low Performance: Websites that convert up to 1.02% of visitors.
- Medium/Good Performance: Websites between 1.02% and 7.90% conversion.
- High Performance: Websites that convert above 7.90%.
The high-performance tier, in particular, saw a significant growth of 0.63 percentage points. If your website is below 3.07%, it's time to investigate.
Conversion by Business Model: B2B vs. B2C
The type of business directly impacts conversion rates. B2B (Business to Business) models, which sell to other companies, tend to have longer and more complex sales cycles, resulting in different conversion rates than B2C (Business to Consumer) models, focused on the end consumer.
- B2B: The median conversion rate is 2.53%. This indicates that more consultative and personalized sales processes are common.
- B2C: The median conversion rate rises to 3.39%. End consumers often make quicker decisions, driven by promotions or immediate needs.
If you operate in a B2B niche and your conversion rate is below 2.53%, in-depth analysis becomes even more critical. For B2C, the goal is to exceed 3.39%.
Performance by Market Segment: Who Leads and Who Lags?
A website's performance is not an isolated factor; it's influenced by the industry the company operates in. Some markets naturally generate more leads due to the nature of the service or product, demand, or consumer behavior.
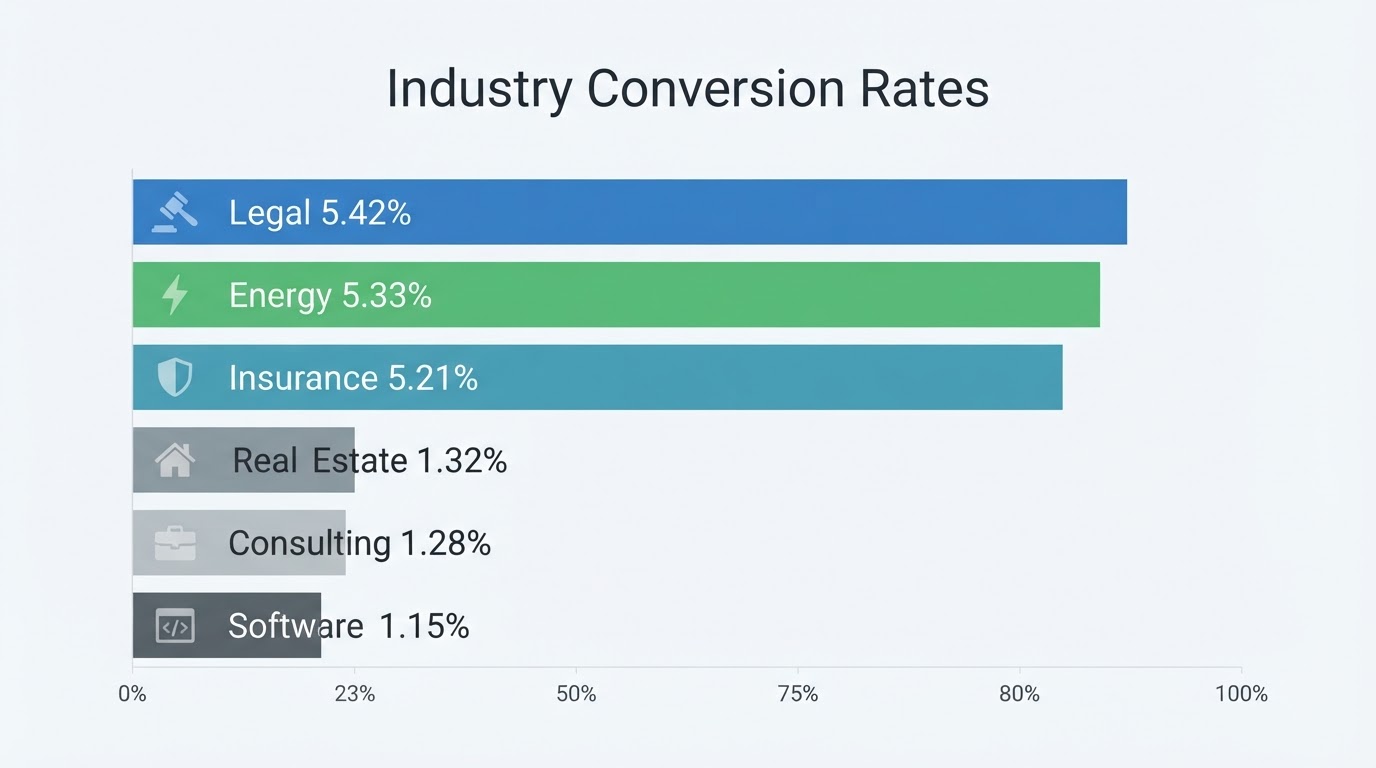
The segments that stand out in lead generation are:
- Legal: 5.42% (up 0.97 p.p.)
- Energy: 5.33% (up 3.43 p.p.)
- Insurance: 5.10% (up 0.92 p.p.)
- Financial: 5.04% (up 1.81 p.p.)
- Medical Services and Health: 4.08% (up 0.01 p.p.)
These sectors demonstrate a high volume of searches for solutions and a clear intent to contact, often driven by urgent needs or significant investments.
On the other hand, the segments with the lowest median performance are:
- Real Estate: 1.32%
- Consulting: 1.71%
- Software: 1.83%
If your website belongs to one of these latter segments, a conversion rate below 1.83% might be considered normal, but there's still room for optimization. For the leaders, the challenge is to maintain or exceed these high rates. You can find more details on conversion rates by segment in this complementary article.
Traffic Sources: Where Do Your Best Clients Come From?
Not all traffic is equal. Knowing where your visitors come from and the quality of that traffic is vital for optimizing your marketing investment. Leadster's study reveals that the source of access directly influences the conversion rate.
See the performance of the main channels:
- Meta Ads (Facebook/Instagram Ads): 3.91%
- Google Ads: 3.41%
- LinkedIn Ads: 2.97%
- Organic Traffic (SEO): 2.39%
- Direct Access: 1.74%
Paid channels, such as Meta Ads and Google Ads, tend to attract an audience with a higher purchase intent or intent to seek solutions, resulting in higher conversion rates. Organic traffic, while fundamental for building long-term authority, generally converts less in the short term. Direct access, which includes users who already know your brand, saw a decrease of 0.34 percentage points, indicating the importance of constantly attracting new audiences.
Devices: Is Mobile Experience a Priority?
Currently, most internet access occurs via mobile devices. The study confirms this trend, with mobile accounting for 74.39% of accesses. However, mobile conversion is 3.37%, slightly lower than desktop, which converts 3.50% with 25.61% of accesses.
The difference in conversion rates between mobile and desktop is small, but the massive prevalence of mobile access demands that the user experience on this device be impeccable. A slow or difficult-to-navigate website on mobile could be costing you many leads.
This doesn't mean desktop should be neglected, but rather that mobile optimization is no longer a differentiator; it's a basic necessity. Loading speed is a critical factor: 64% of users abandon a website when it takes too long to load.
Artificial Intelligence Traffic: A New Frontier
Traffic generated by Artificial Intelligence (AI) tools is still a niche, representing only 0.10% of the total analyzed accesses, which equates to 170.5 thousand accesses. Of these, the majority come from ChatGPT (78.36%), followed by Perplexity (8.42%) and Gemini (5.87%).
Although the volume is low, it's an indicator of how AIs are beginning to influence information search and consumption. For your website, this could mean new ways to attract visitors or the need to adapt content to be understood and recommended by these tools. If you're looking to understand how to measure this traffic, check out our guide on how to see AI traffic in Google Search Console.
Frequently Asked Questions
Why doesn't my website generate leads even with traffic?
Your website might not be generating leads due to a combination of factors, such as a conversion rate below your sector's average, poor user experience (especially on mobile), unclear or non-existent calls to action (CTAs), or low-quality traffic coming from poorly segmented channels.
What is the ideal conversion rate for a website?
The ideal conversion rate varies greatly by sector. The overall Brazilian median is 3.07%. However, segments like Legal reach 5.42%. The most important thing is to compare your performance with the average for your segment and strive for continuous improvement to exceed the 7.90% of the high-performance tier.
How can I improve my website's conversion rate?
Improve user experience (UX), especially on mobile devices, optimize loading speed, create clear and visible CTAs, use simple forms, offer valuable content in exchange for contacts (like e-books or webinars), and refine the segmentation of your marketing channels to attract the right audience.
Does organic traffic convert less? Why?
Organic traffic generally converts less in the short term because it attracts users at different stages of the buying journey, many still in the research and learning phase. Although crucial for authority and qualified leads in the long term, it requires time to mature and convert compared to targeted paid campaigns.
Conclusion: Turning Visits into Clients
Understanding your website's numbers is the first step to transforming it into a client-generating machine. Comparing your performance against the Brazilian average and high-performance benchmarks, segmented by business and channel, provides an accurate diagnosis.
Recommendation for today: Access your Google Analytics and your marketing tool's conversion report. Compare your current rates with the numbers presented in this post. Identify the most critical area and start planning a focused improvement action for it.

About Lee Sugano
Lee Sugano
Digital solutions agency based in Japan, serving clients in 10+ countries. We share insights on development, design and digital marketing for companies that don't settle for generic.
Enjoyed this content?
Receive exclusive insights about web development, design, and digital marketing straight to your inbox.
No spam. Unsubscribe anytime.