Where to check in Insights if your Reel holds attention
Skip rate, the retention graph, average watch time, and shares show whether your Reel holds viewers. Where to find each number in Instagram Insights, how to read it, and what to change in your next video.
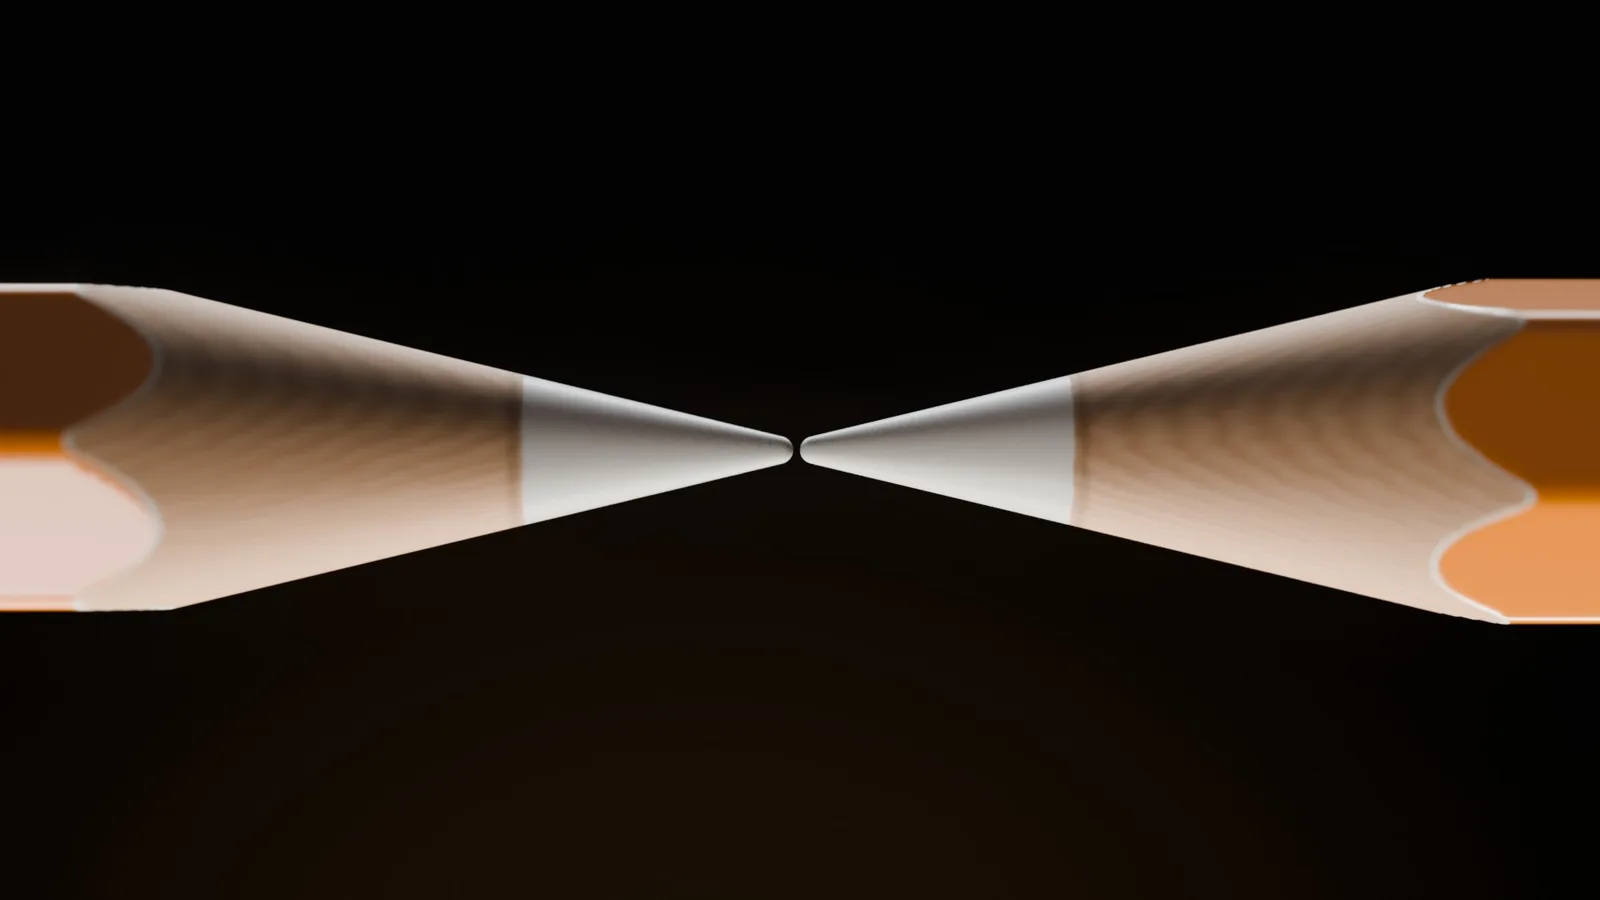
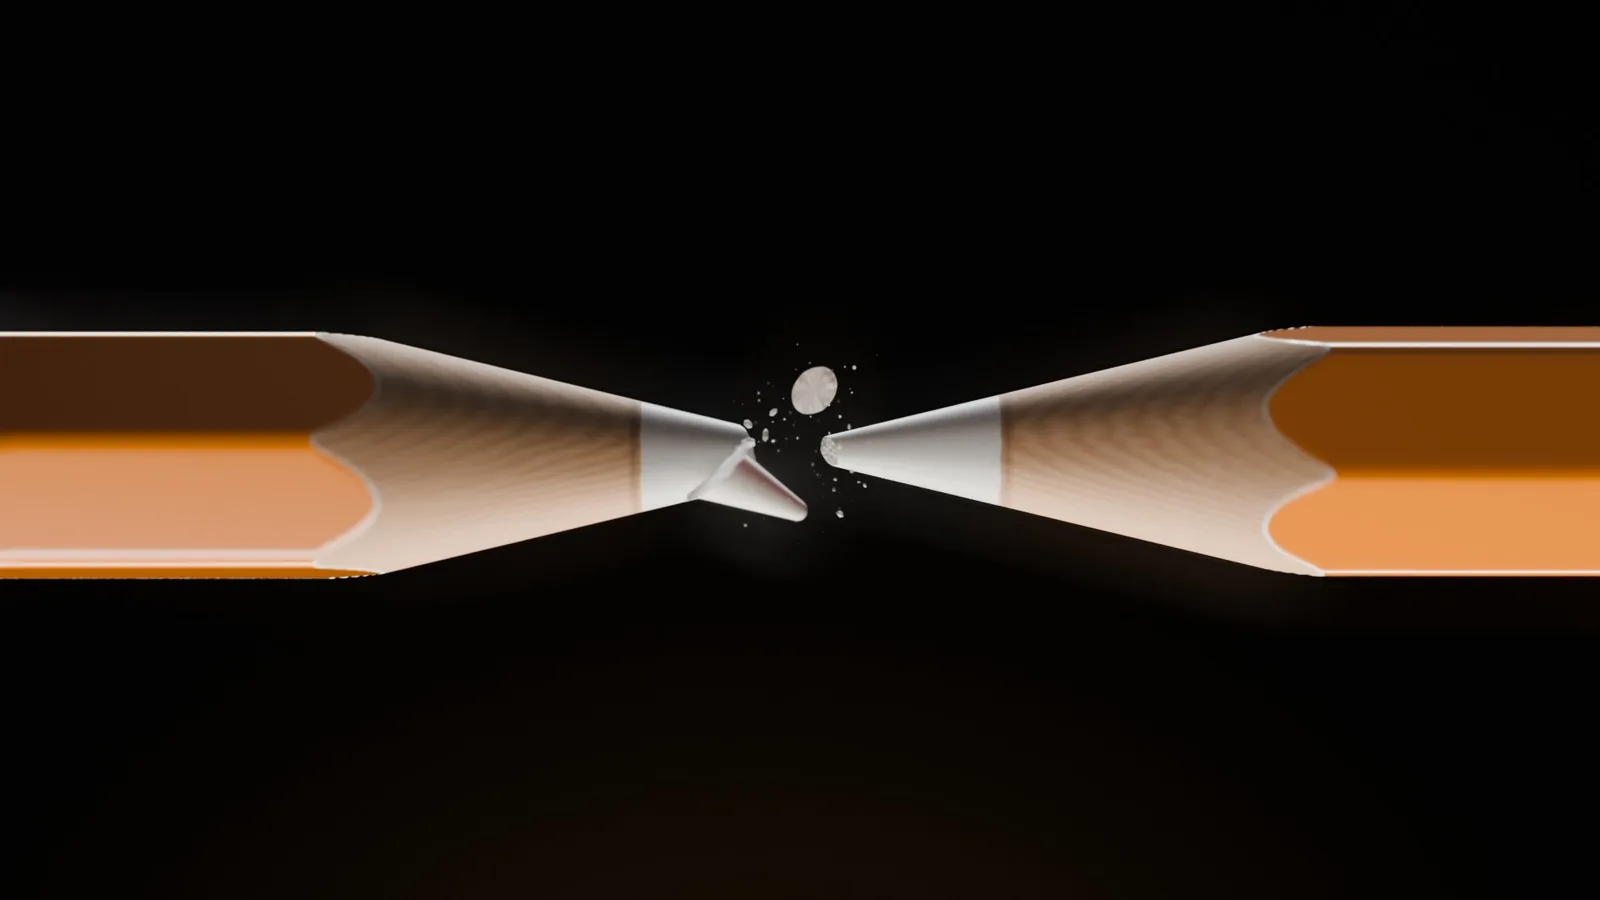
If you got here from the pencil Reel, you already know firsthand what attention retention is: you kept waiting for the tip to break and didn't swipe to the next video. Instagram measures exactly that, Reel by Reel, and shows the numbers to whoever posted. Almost nobody opens that screen.
This guide shows where those numbers are, what each one means, and how to compare your own videos to decide on the next one.
How to open a Reel's insights
- Open your profile and tap the Reels tab.
- Tap the Reel you want to analyze.
- Tap View insights.
According to the Instagram Help Center, the account needs to be public (personal or professional), and the numbers are available for up to two years after posting. The same page explains each metric, and one of them already answers a good part of the question "does my Reel hold attention?": average watch time.
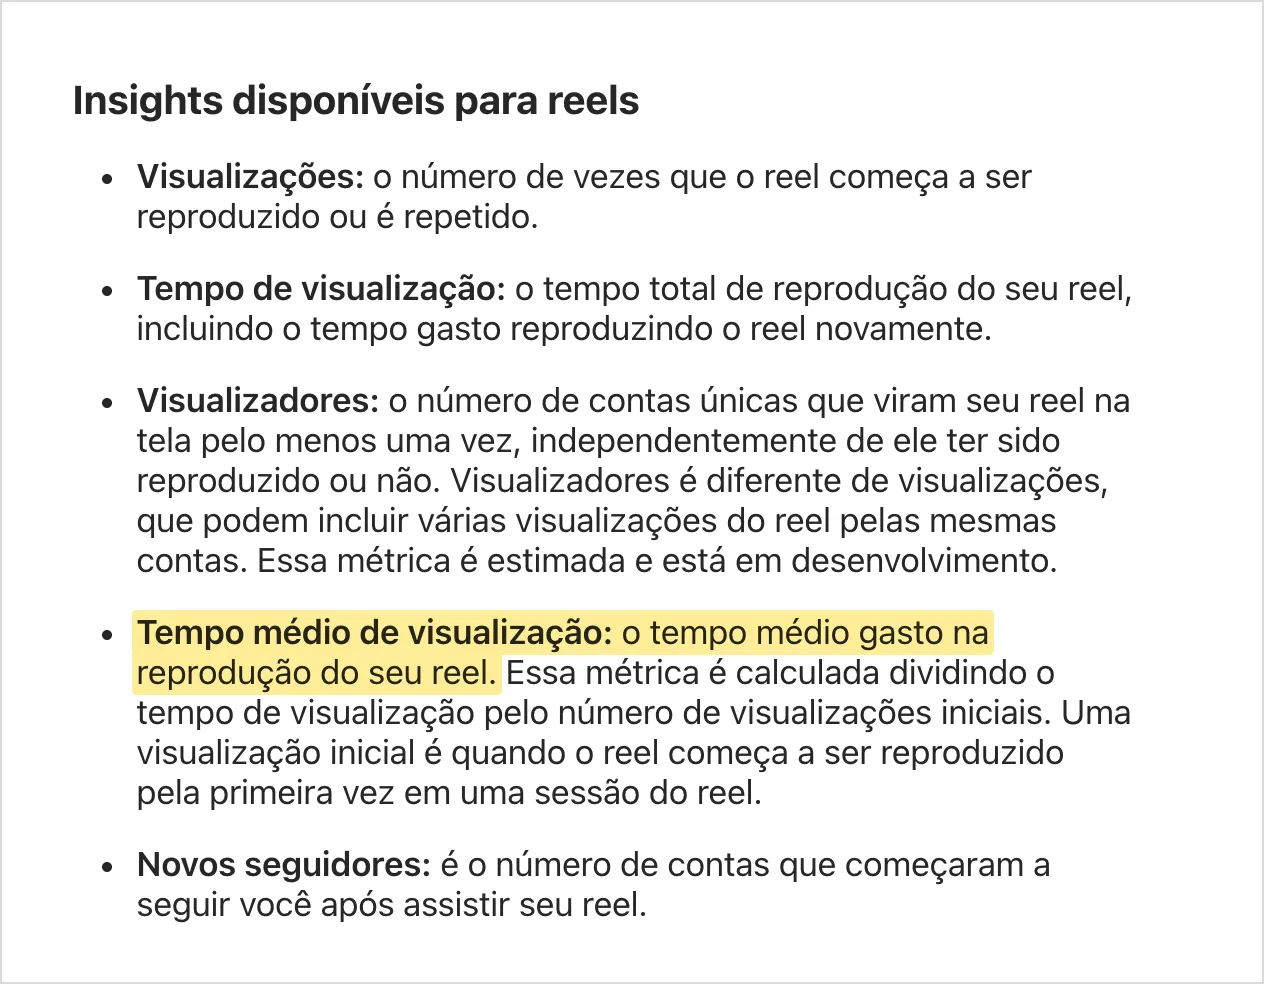
Along with these, in August 2025 Instagram announced two more things that speak directly to attention: skip rate and the retention graph. These are the four numbers below, in this order.
1. Skip rate: who left in the first 3 seconds
It's the percentage of views in which the person swiped past the Reel before reaching 3 seconds. It replaced the old view rate, which showed the opposite (who watched beyond 3 seconds). The name on screen may vary a bit from one app version to another; look for the metric about the first 3 seconds.
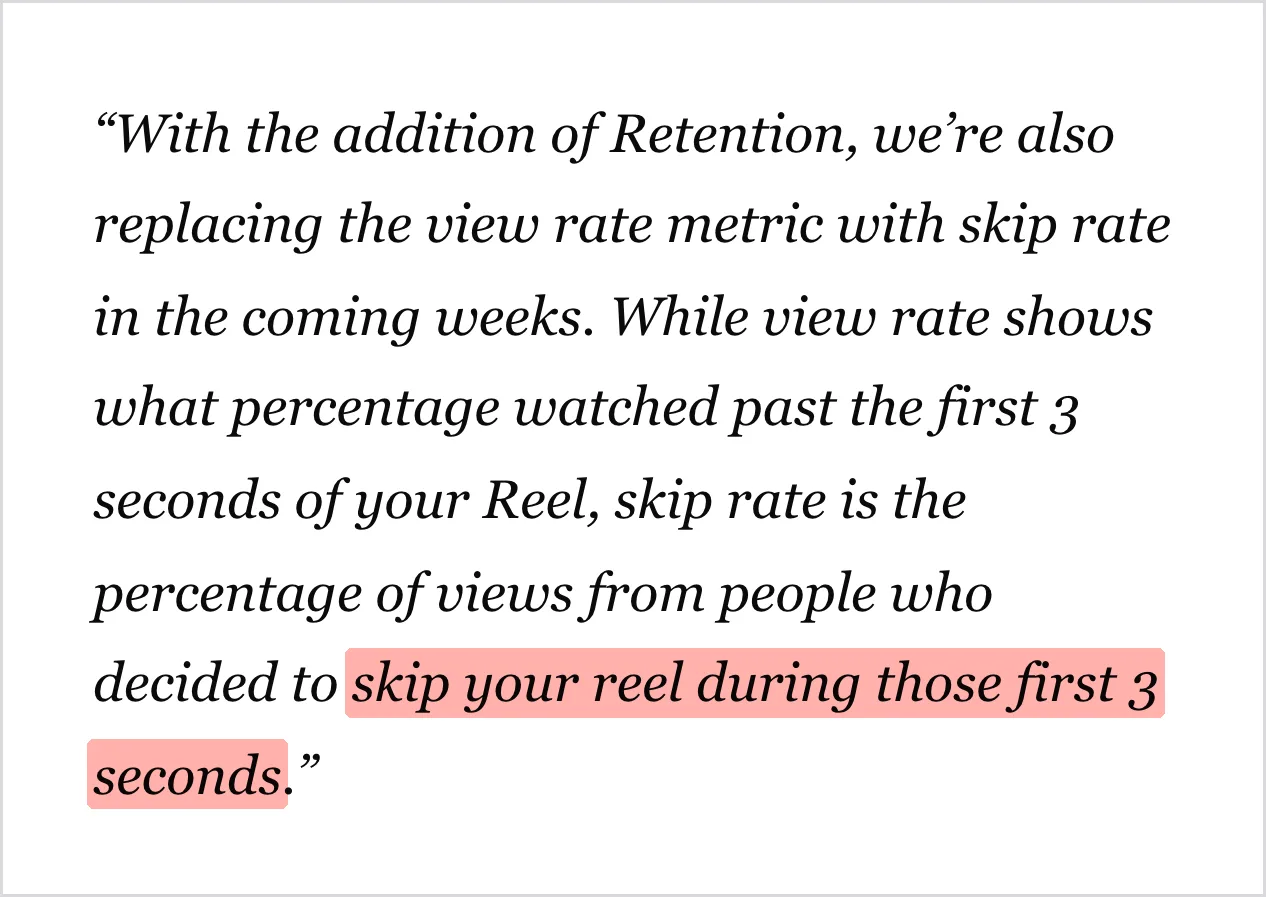
How to read it: the lower, the better. A high rate means the opening didn't convince: the person saw the first instant of the video and decided it wasn't worth staying. Whoever skips there doesn't see the rest, no matter how good the rest is.
What to change when it's high: the first second. Start with something already happening, a question, or a clear promise, and leave the intro, the logo, and the "hey, guys" for later.
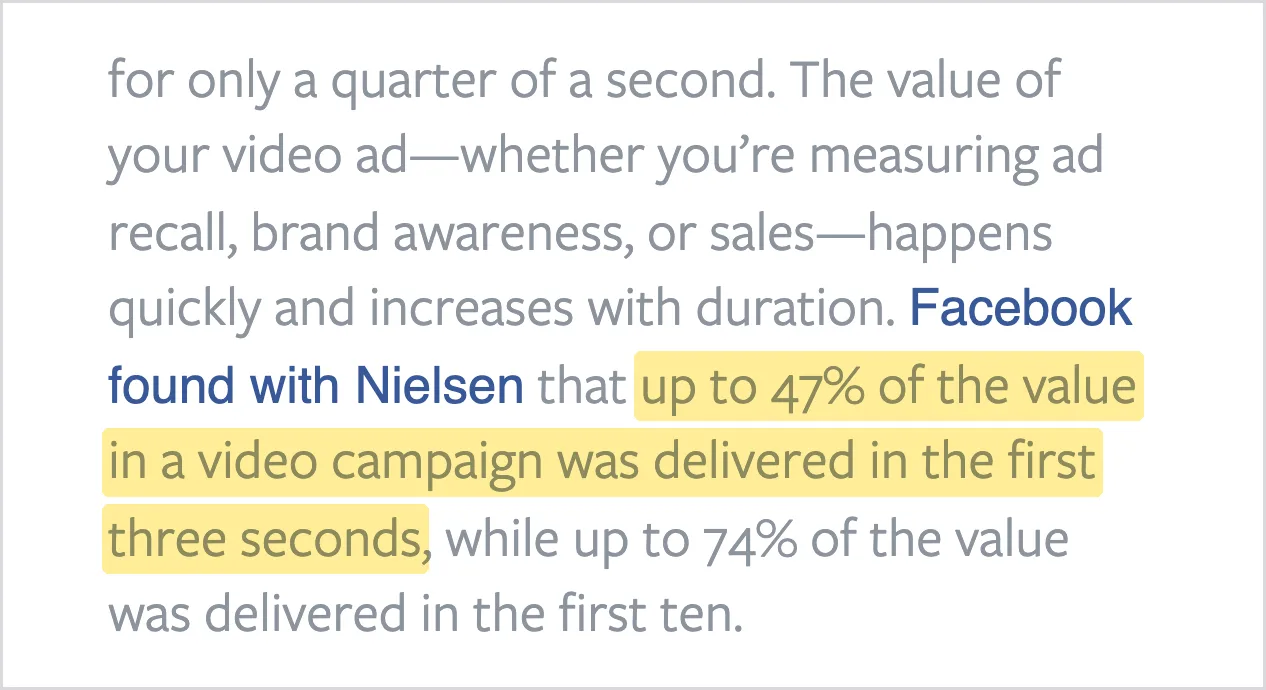
The 3 seconds are no exaggeration. In 2016, Meta (Facebook at the time) reported that, in a study conducted with Nielsen, up to 47% of a video ad campaign's value, whether in ad recall, brand awareness, or sales, came from the first 3 seconds.
2. Retention graph: at which second people give up
The graph shows, moment by moment, the percentage of views in which the person was still watching. It always goes down. Instagram itself sums up how to read it: the flatter the line, the more engaged the audience.
The most common shapes and what they usually indicate:
- Sharp drop right at the start: the problem is the hook. It's the same message as the skip rate.
- Drop at a point in the middle: scrub the video back to that second. Usually there's a long pause, an explanation that drags, a static scene, or the answer to the opening question delivered too early.
- Nearly flat line to the end: the video held. See what sets it apart from the others, because that's your template.
The pencil Reel was built with this graph in mind: the question (will it break or not?) appears in the first second and is only answered at the end. While the question is open, the viewer has a reason to stay. Psychology has a name for this: according to researcher George Loewenstein, curiosity arises from a gap between what we know and what we want to know. A Reel that opens this gap right away and only closes it at the end tends to have a flatter line.
3. Average watch time: how much of the video was seen
The Help Center defines it as the average time spent playing the Reel: total watch time divided by the number of initial plays (the first time the Reel starts playing in a session). On its own, this number is misleading, because a 60-second Reel has a higher average time than a 15-second one with almost no effort.
So divide it by the video's length. A 40-second Reel with an average watch time of 20 seconds was watched, on average, halfway through. This percentage can be compared across videos of different lengths, and it's the simplest way to track retention in a spreadsheet.
4. Sends: the signal that takes your Reel to people who don't follow you
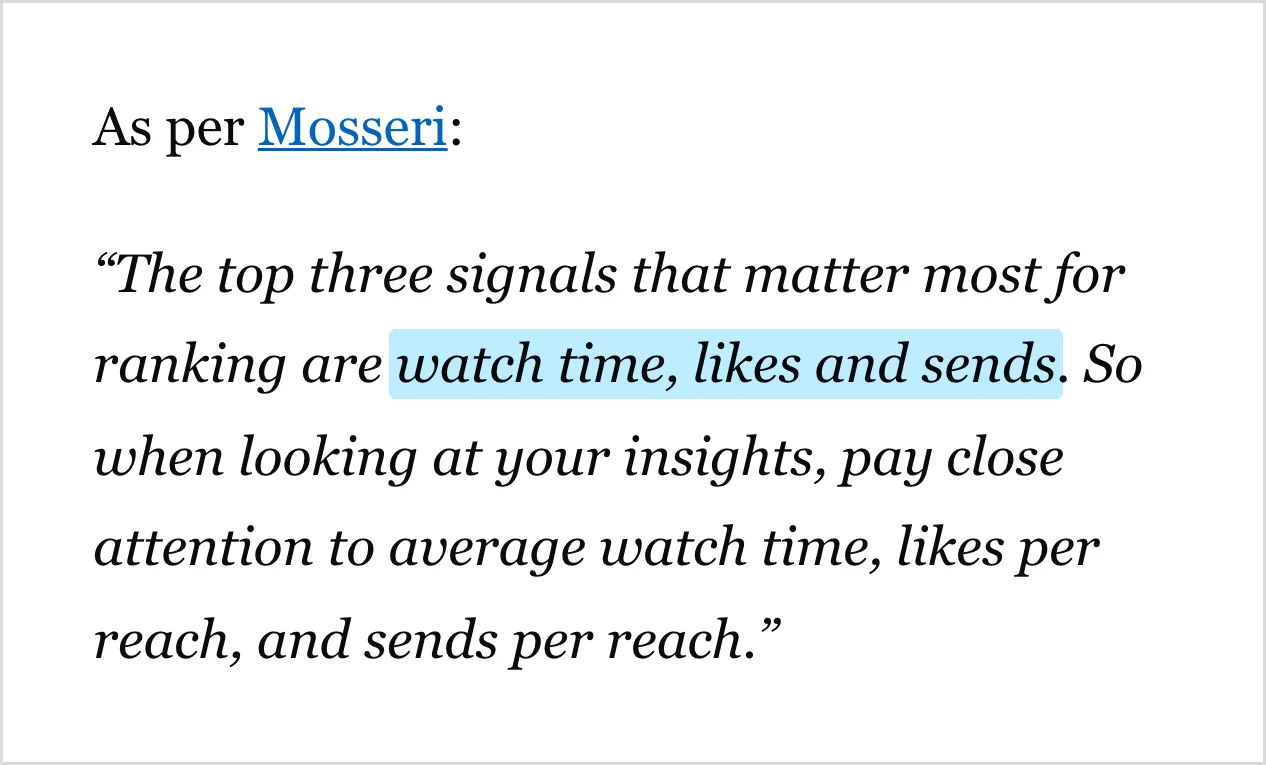
In January 2025, Adam Mosseri, head of Instagram, said the three signals that matter most when Instagram decides who to show a video to are watch time, likes, and sends (when someone shares the Reel with another person). He went into detail: likes carry a bit more weight among people who already follow you, while sends carry a bit more weight for reaching people who don't follow you yet.
In insights, sends show up as shares. Compare them with likes: a Reel that gets a lot of shares relative to likes is usually one that solves a problem or reminds people of someone. That's the kind of video most likely to break out of your bubble.
Before comparing: the video has to be yours
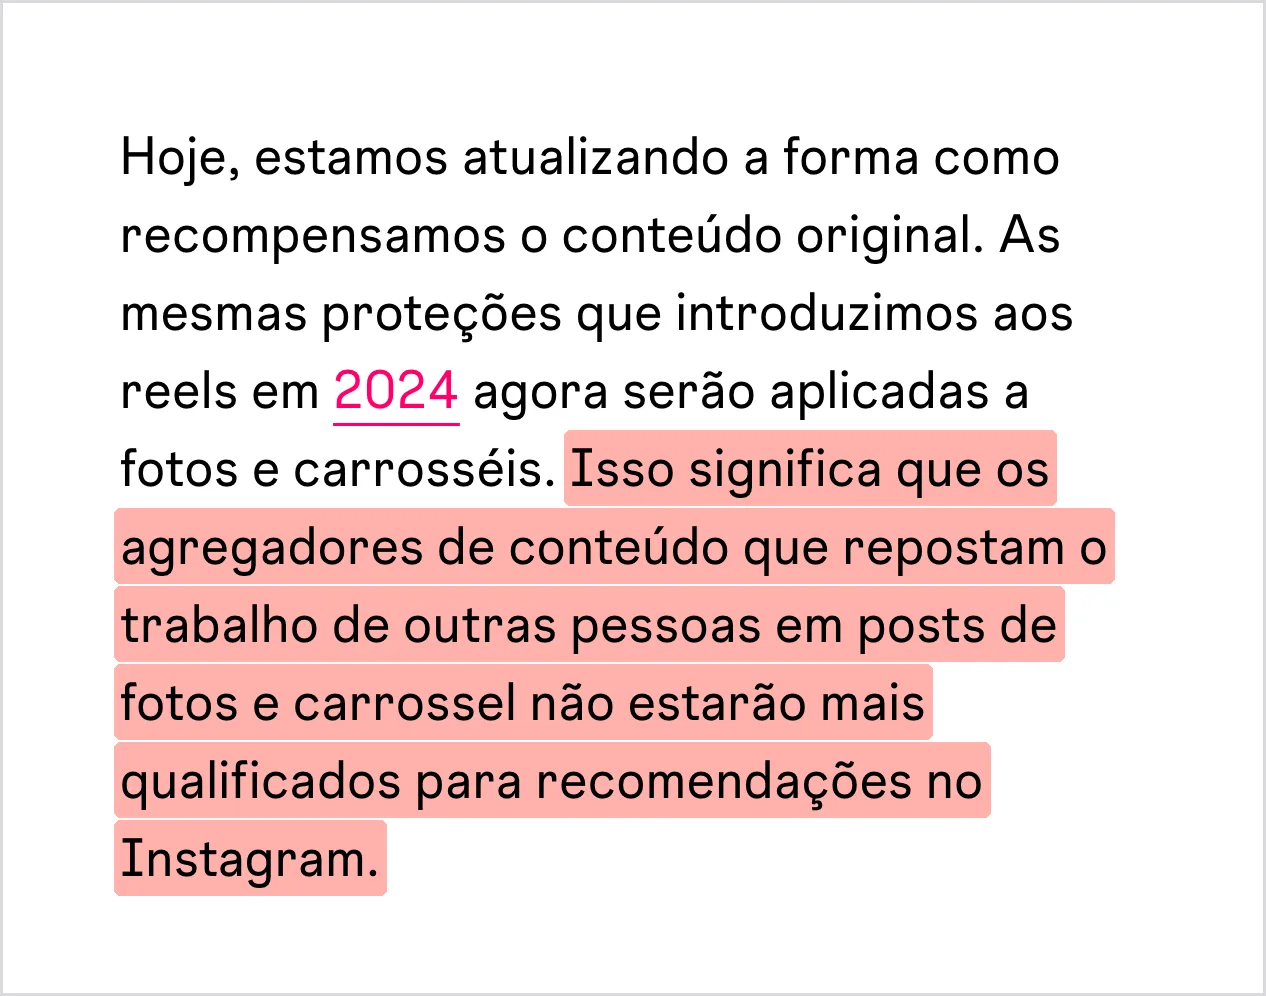
Since 2024, Instagram has removed from recommendations the Reels of accounts that rely on reposting other people's work, and in April 2026 it extended the rule to photos and carousels. People who already follow the account still see it, but the content stops being shown to non-followers. Adding a border, watermark, caption, or credit on top of someone else's video does not make the content original. The account becomes eligible for recommendations again when most of what it posted in the last 30 days is original.
In other words: good retention on a reposted video won't take your business anywhere. Reach among people who don't know you depends on the video being yours: your product, your team, your voice.
How to compare your Reels (the part that makes a difference)
Instagram doesn't disclose what skip rate or retention counts as "good," and the ideal numbers floating around the internet have no official source. They vary from niche to niche and from account size to account size. What works is comparing your videos against each other:
- Take your last 10 Reels and look at all of them at the same age (for example, 7 days after posting) so the comparison is fair.
- Write down the numbers from the table below for each one.
- Pick the 3 with the lowest skip rate and watch the first second of each. What do they have in common?
- Pick the 3 with the flattest retention line. Where did the line stay flat, and what was happening in that section?
- Use what worked as the template for your next video and change one thing at a time, so you know what made the difference.
| What to write down | What it shows |
|---|---|
| Skip rate | Whether the opening hooks people |
| Biggest drop-off point in the retention graph | The second at which people give up |
| Average watch time divided by length | How much of the video was watched, on average |
| Shares | Whether the video has a chance of reaching people who don't follow you |
| Views | The result (a consequence of the four above) |
Checklist for your next Reel
- Something happening from the very first moment, with no intro bumper or logo at the start.
- An open question that only gets resolved at the end.
- No long pauses or repeated explanations in the middle.
- A reason to send it to someone: a useful tip, a situation people recognize themselves in.
- Your own content: your business, your product, your people.
Frequently asked questions
"View insights" doesn't show up on my Reel. Why?
Insights only appear on public accounts, for Reels posted on or after May 14, 2021, and for up to two years after posting. If the account is private, it needs to be made public for the numbers to appear.
Do I need a professional account?
According to the Help Center, no: public personal accounts can also see Reels insights.
What's a good skip rate?
Instagram doesn't disclose it. The most useful benchmark is your own history: if your skip rate is dropping month over month, your hooks are improving.
Aren't views the most important number?
They're the result, but on their own they don't explain anything. Skip rate, retention, and sends show why a Reel got more or fewer views, and that's what helps you make the next one better.
Is it worth making shorter Reels to boost retention?
Only if the content fits. Cutting slow sections helps; cutting the explanation people came for doesn't. Compare the percentage watched (average watch time divided by length), not just average watch time, so you don't penalize longer videos.

About Lee Sugano
Lee Sugano
Digital solutions agency based in Japan, serving clients in 10+ countries. We share insights on development, design and digital marketing for companies that don't settle for generic.
Enjoyed this content?
Receive exclusive insights about web development, design, and digital marketing straight to your inbox.
No spam. Unsubscribe anytime.